

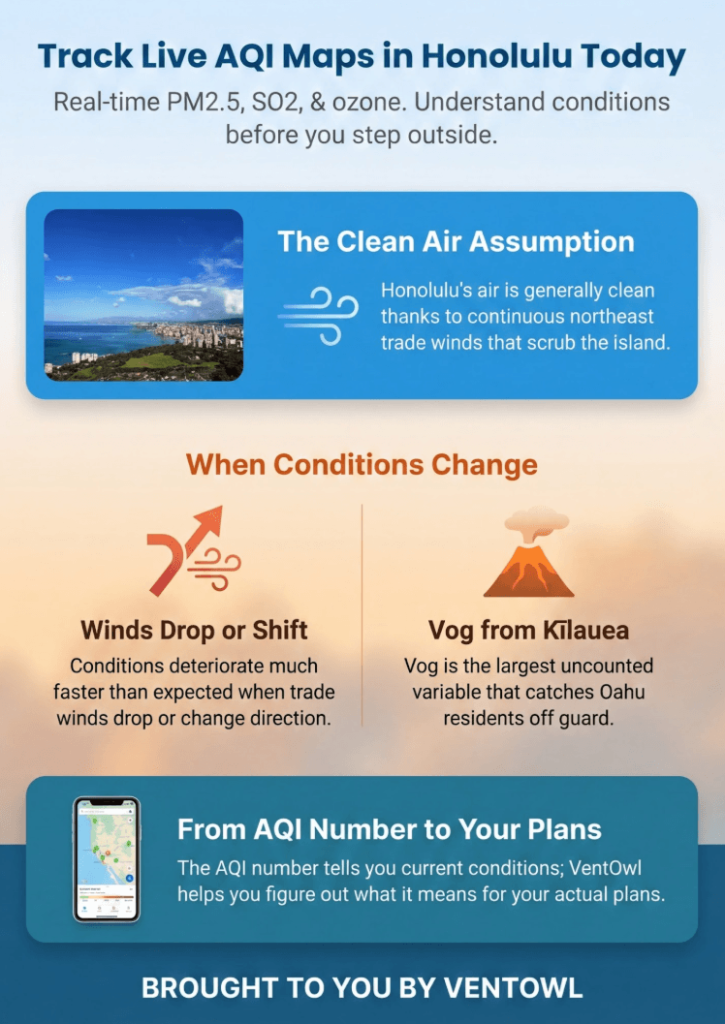
Most days in Honolulu, the live AQI map confirms what everyone already assumes: the air is clean. Trade winds scrub the island continuously, and the readings reflect it. But we’ve tracked enough Hawaii air quality events to know that assumption is the thing that catches people off guard. Vog from Kīlāuea moves faster than most residents expect. Trade winds drop without much warning. The leeward side of Oahu, where Honolulu sits, is the last place on the island to feel the relief when conditions clear.
The live air quality index AQI map now today in Honolulu Hawaii gives you the real-time PM2.5, SO2, and ozone picture across Oahu. At VentOwl.com, we make that data useful — so you understand what today’s conditions actually mean for your plans before you step outside.
The Air Quality Index runs from 0 to 500. Lower numbers mean cleaner air; higher numbers signal conditions that can affect your health, especially for sensitive groups. Whether you’re planning a beach run, a hike up Diamond Head, or just deciding whether to open the windows at home, the live map is worth checking before you go.
TL;DR Quick Answers
Live Air Quality Index AQI Map Now Today in Honolulu Hawaii
The live air quality index AQI map now today in Honolulu Hawaii shows real-time PM2.5, SO2, and ozone conditions across Oahu, updated from official EPA and Hawaii DOH monitoring stations.
Why it matters:
- Vog from Kīlāuea can push air quality readings in unexpected directions statewide, with little advance notice.
- Trade wind patterns shift throughout the day and can trap or clear pollution differently across Oahu’s windward and leeward sides.
- Checking live conditions — not yesterday’s readings — is what actually protects residents, visitors, and sensitive groups.
VentOwl’s take:
- The AQI number tells you the current condition.
- What that number means for your day is the part we help you figure out.
- A 30-second check before outdoor activity is the single most useful air quality habit you can build in Honolulu.
Top Takeaways
Here’s what you need to know about Honolulu air quality before you go outside today:
- Honolulu’s air is generally cleaner than most U.S. cities, but that clean air depends on the trade winds staying consistent. Those winds run northeast across Oahu continuously, keeping local pollution from accumulating. When they drop or shift direction, conditions can deteriorate faster than an AQI number from three hours ago would suggest.
- Vog from Kīlāuea is the variable most people don’t account for. When southerly winds replace the usual northeast trades, volcanic SO2 and aerosol particles travel up the island chain from the Big Island and reach Oahu — sometimes from more than 200 miles away. Hawaii DOH issued a formal statewide vog advisory as recently as April 2025.
- Live AQI data tells a different story than reputation alone. Honolulu pollution levels shift with the time of day, wind conditions, and volcanic activity. The pattern we see most often in Hawaii air quality monitoring: residents assume the air is fine because it usually is, then get surprised on the days it isn’t.
- Certain groups need to check before they go out, every time. Children, older adults, and anyone managing asthma, COPD, or a heart condition are the most vulnerable when air quality drops, even briefly. The consequences for those groups are disproportionate to what most healthy adults feel on the same day.
- The AQI number alone doesn’t tell you what to do. VentOwl adds the context layer, so you understand what today’s reading means for your actual plans across Oahu — not just what the scale says in general.
Table of Contents
Check the Live Air Quality Index AQI Map Now Today in Honolulu Hawaii
This page helps you quickly assess whether Honolulu’s air is clear, shifting toward moderate conditions, or being affected by vog, particulate pollution, or changing weather patterns. At VentOwl.com, we don’t just show you the number. We help you understand what it means for your day.
What Honolulu’s AQI Means Right Now
The Honolulu AQI today tracks PM2.5, SO2, ozone, and carbon monoxide against EPA health thresholds and converts those levels into a single color-coded reading. It’s a useful shorthand for outdoor conditions at any given moment.
Most days, Honolulu’s readings land in the Good range — and that’s accurate. The northeast trade winds do real work here, moving fresh ocean air across Oahu continuously and keeping local pollution from building up the way it does in mainland urban corridors.
What the island’s daily reputation doesn’t capture is Kīlāuea. When the volcano on Hawaii Island pushes elevated SO2 emissions into the atmosphere, those gases react with sunlight, oxygen, and moisture to form vog: a haze of sulfuric acid aerosol and fine particles. When wind patterns shift, that vog reaches Oahu. That’s when Honolulu EPA air quality readings can spike in ways that catch residents completely off guard.
Why Air Quality Can Change Throughout the Day on Oahu
Oahu air quality now reflects more than local traffic or emissions. The island’s geography, trade wind cycles, and the ongoing activity at Kīlāuea interact in ways that can shift conditions from neighborhood to neighborhood within the same hour.
- Morning (6 to 10 AM): Trade winds are typically strongest. Air quality on Oahu’s windward side is generally at its best, making this the most reliable window for extended outdoor activity on most days.
- Midday to afternoon (11 AM to 3 PM): Sea and land breeze cycles begin shifting. Pollution from traffic accumulates on Honolulu’s leeward side. Ozone builds on warm, sunny days, sometimes reaching levels that matter for sensitive groups.
- Late afternoon and evening: Thermal inversions trap pollutants closer to the surface, particularly in valley corridors across Oahu, and conditions can stay elevated into the night.
- Anytime, vog conditions: When Kona winds replace the northeast trades, vog from Kīlāuea arrives with little advance notice. This is the most unpredictable variable in Hawaii outdoor air quality and the one most worth monitoring in real time.
Who Should Pay Closest Attention to Honolulu Air Quality Today
Hawaii outdoor air quality affects everyone, but some groups face meaningfully higher risk when readings climb.
- Children and teenagers, whose developing lungs are more sensitive to SO2 and fine particle exposure
- Older adults, especially those with existing heart or lung conditions
- People managing asthma, COPD, chronic bronchitis, or cardiovascular disease
- Pregnant residents and visitors, because particulate pollution and SO2 exposure carry documented health risks during pregnancy
- Outdoor workers, surfers, hikers heading to Diamond Head or the Koʻolau Range, and anyone planning extended time outside
In our experience tracking Hawaii’s air quality, the people who get caught off guard are the ones who assume Honolulu’s clean-air reputation applies equally on every day and in every neighborhood. It usually holds. But when it doesn’t, those are the days that matter most for the groups above.
“We’ve seen how quickly Honolulu’s air quality can shift from a clean trade wind day to a vog-affected afternoon when Kona conditions develop — and the people who feel it first are always the ones with respiratory sensitivities who went outside without checking. That’s exactly the gap VentOwl is built to close.”
Essential Resources
These are the sources we rely on to answer the questions that matter most when Honolulu’s air quality is in question: what the official AQI shows right now, whether vog or particulate matter is driving current conditions, whether a state advisory is active, what neighborhood sensors are picking up, and what weather shifts might change the picture later today.
Hawaii Interagency Vog Information Dashboard
When vog is the question, this dashboard is the answer. USGS, Hawaii DOH, NOAA, and the National Park Service built it together to give residents and officials a single reliable view of volcanic SO2 and vog conditions statewide. During active or elevated Kīlāuea eruption periods, check this before anything else.
EPA’s official statewide air quality data portal covers all Hawaiian islands, updating hourly from regulatory-grade monitoring stations. Use it to compare Honolulu’s current readings against conditions across the rest of Hawaii, and to catch smoke or vog advisories as they’re issued. It’s the most reliable statewide view of Hawaii AQI real-time data available.
When wildfire smoke is a factor — whether from local Hawaii fires or smoke crossing the Pacific from the western U.S. mainland — this is the map to pull up. EPA and the U.S. Forest Service built it together. It combines current particle pollution readings, active fire locations, and smoke plume data in one view, making it the most authoritative tool available when Hawaii air quality map conditions involve smoke.
Official regulatory monitors give you the county-level picture. PurpleAir’s private sensor network fills in the neighborhood-level gaps, updating frequently enough to surface localized hotspots before broader area summaries catch them. Read PurpleAir alongside official data, not instead of it — EPA notes that private sensors carry more uncertainty for health interpretation. For tracking block-by-block variation across Honolulu and Oahu, though, it’s the most practical tool available.
Hawaii DOH — Vog and Air Quality Health Advisories
Hawaii DOH issues formal advisories during Kīlāuea eruptions and elevated volcanic gas events, with specific protective guidance for children, older adults, pregnant people, and anyone managing respiratory or cardiovascular conditions. If you or someone in your household falls into one of those groups, bookmark this page and check it whenever vog reports are circulating.
National Weather Service — Honolulu Forecast Office
Trade wind strength, Kona wind development, rainfall, and thermal inversions determine how Honolulu’s air quality evolves through the day. The NWS Honolulu forecast gives you the meteorological context to anticipate those shifts before they show up on the AQI map — which makes it especially useful on days when trade winds are forecast to weaken and vog transport risk increases.
Supporting Statistics
We rely on verified monitoring data and real health research to frame the live AQI picture. Here are three specific data points that explain why Honolulu air quality tracking matters more than most residents assume.
Statistic 1 — Hawaii’s Statewide Monitoring Network
Hawaii’s Clean Air Branch operates a permanent statewide monitoring network across all major islands, with multiple stations on Oahu measuring SO2, PM2.5, and other regulated pollutants continuously.
That data feeds directly into the EPA AQI readings for the Honolulu metro area. It’s publicly accessible, updated in real time from regulatory-grade equipment, and the foundation that every other resource on this page points back to.
Source: Hawaii Department of Health, Clean Air Branch | health.hawaii.gov/cab/hawaii-ambient-air-quality-data/
Statistic 2 — Vog Reaches Honolulu Even When Kīlāuea Pauses
In April 2025, Hawaii DOH formally warned residents that Kīlāuea’s 18th episodic eruption had paused — but volcanic gas emissions remained elevated and continued generating vog and poor air quality across the islands.
The mechanism matters. When southerly Kona winds replace the northeast trades, vog travels north up the island chain and increases concentrations statewide, including on Oahu. That’s a direct transport path from a volcano on the Big Island to the air above Honolulu, more than 200 miles away. The advisory is verified. The transport pathway is documented.
Source: Hawaii Department of Health, Office of Communications | health.hawaii.gov/news/newsroom/doh-warns-of-potential-health-hazards-from-kilauea-vog-as-eruption-pauses/
Statistic 3 — Vog Exposure Linked to Respiratory Symptoms in Hawaiian Children
A study published in PubMed Central tracked communities across multiple vog exposure zones on Hawaii Island from 2002 through 2005. Children in higher-exposure zones showed statistically significant associations with respiratory symptoms, diagnosed asthma, bronchitis, and reduced lung function.
That research wasn’t conducted in Honolulu. But the exposure pathways it documented are the same ones that activate whenever Kona winds carry vog from Kīlāuea to Oahu. What happens to children in high-exposure zones on the Big Island is the same biological process — at lower intensity — when the wind shifts toward Oahu.
Source: U.S. National Library of Medicine / PubMed Central | pmc.ncbi.nlm.nih.gov/articles/PMC4905765/
Final Thoughts and Opinion
Why This Matters
Honolulu’s air quality story is harder to tell than its reputation makes it seem. Clean air here depends on one system working correctly: the northeast trade winds. When those winds hold, the island’s natural filtration runs continuously, and Oahu’s readings reflect it. When they don’t, conditions shift in ways most residents never see coming.
We’ve tracked the moments that break through the baseline — trade wind collapses, vog events from Kīlāuea, wildfire smoke crossing from the western U.S. mainland. What those moments share is that they’re invisible without live data. The Honolulu air quality forecast tells you what’s predicted. The live map shows you what’s actually there. Those two things don’t always agree, and the difference matters most on the days when conditions have already moved.
The gap we see most consistently is assumption. Honolulu residents trust the island’s reputation — reasonably so, because most days it holds. But “most days” offers no protection on the specific day it doesn’t. For a child with asthma, an older adult with a heart condition, or anyone spending hours outside during a quiet vog event, the assumption is the real risk. Hawaii wildfire smoke air quality and vog events don’t announce themselves.
VentOwl’s Perspective
A live AQI map in a city with generally clean air is easy to skip. That’s exactly what makes Honolulu interesting. The value isn’t catching emergencies, because emergencies here are rare. The value is catching the shifts that don’t look like emergencies until you’re already outside in them.
Checking live Honolulu air quality today takes under a minute. We built this page to make that minute worth it — turning monitoring station data into something you can actually use before heading to Diamond Head, Waikiki, or anywhere across Oahu. At VentOwl.com, that’s the job: not just the number, but the context it carries.
Frequently Asked Questions
Q: What does the live air quality index AQI map now today in Honolulu Hawaii help users understand?
The map shows real-time PM2.5, SO2, and ozone conditions across Oahu, drawn from EPA and Hawaii DOH monitoring stations. Residents and visitors can quickly check whether current air quality is safe for outdoor activity, whether vog or particulate pollution is driving today’s readings, and whether conditions are holding steady or shifting across different parts of the island.
Q: Why should users check the live Honolulu AQI map more than once today?
Honolulu’s air quality can shift meaningfully between morning and afternoon. Trade wind strength, thermal inversions in valley corridors, leeward-side pollution accumulation, and vog transport from Kīlāuea all work on different timelines. A reading that looks clean at 7 AM may look different by noon, particularly on low-wind days or during active vog events.
Q: Who should pay the closest attention to Honolulu air quality today?
Children, older adults, and anyone managing asthma, COPD, or heart conditions should check live conditions before extended outdoor exposure. Surfers, hikers, cyclists, outdoor workers, and tourists planning activities at Diamond Head, Hanauma Bay, or the North Shore should also check the live AQI before heading out. When vog is present, it hits sensitive groups first and hardest.
Q: Can air quality vary across different parts of Oahu at the same time?
Yes. The Koʻolau mountain range splits Oahu into windward and leeward sides, and those two sides can read very differently at the same time. Honolulu sits on the leeward side, which is more prone to pollution accumulation when trade winds weaken. PurpleAir’s neighborhood sensor network is the best tool for tracking those localized differences as they develop.
Q: How does vog from Kīlāuea affect Honolulu’s AQI?
Kīlāuea emits SO2 gas that reacts with oxygen, moisture, and sunlight to form vog — a haze of sulfuric acid aerosol and fine particles. When Kona winds replace the northeast trades, that vog travels north up the island chain and reaches Oahu. The Hawaii Interagency Vog Dashboard and Hawaii DOH advisories are the most reliable sources for tracking those events in real time and knowing what protective action to take.
Honolulu’s Air Quality Can Change Fast — Don’t Wait to Make Smarter Outdoor Decisions
Most days in Honolulu, the live map confirms what everyone expects. But trade winds shift, vog moves, and the readings change. When conditions move, they move without announcing it.
Check the live AQI map in Honolulu Hawaii before your next outdoor activity. At VentOwl.com, we help you move from the number to the decision — faster and with the full picture in front of you.